Lip Sync For Your Life — Are the Winners Easy to Predict?
A data project for UPenn OIDD-245
Rupaul’s Drag Race is a heavily produced show, known for its excessive use of sound effects, confessionals, and other drama-inducing tactics employed by reality shows. The elimination portion of the show is no exception to that. At the end of each episode, the two worst-performing queens of the week lip sync for their lives for a chance to stay in the competition. The winner is decided by RuPaul herself (at least according to the show’s narrative), so there are no formal scoring metrics. However, there may be some hints during the performance that may be able to reliably clue audiences into the winner.
When Season 6 of Rupaul’s Drag Race came out, I remember seeing talk on the r/rupaulsdragrace Reddit about how the sound effect used on each queen before the start of the lip sync gave away the winner (a thunder sound was more often used on the winner of the lip sync while a horn sound was given to the loser). In my opinion, the over-production is part of the fun, but it made me wonder if there really was an editing formula, one that extended beyond just the aforementioned sound effects.
My goal here is to analyze aspects of these lip sync performances that result from simple editing choices, mainly how much screen time each queen in the Bottom Two receives. I was also curious if the characteristics of an episode’s song had any impact on those screen time findings.
Data Collection
Unfortunately, there is no data set that has screen time breakdowns on these lip syncs, and I am no AI wiz. So, I hand collected it using iMovie. Splicing the clips by hand to tally up the time into three categories:
- Individual Screen Time of the Winner
- Individual Screen Time of the Loser
- Share Screen Time by the Winner and the Loser
Confessionals and cuts to the judges were not included in the time. These metrics only included when the Bottom Two queens were on camera starting from when RuPaul says “and don’t fuck it up” and until the song ends and the clapping begins.
Because this process was insanely tedious, I only took data from 5 seasons: 1, 2, 3, 6, and 7. I personally enjoy the older seasons more, and I picked data from the oldest seasons and then from the newer seasons where the editing began to pick up, so I could see if there were any differences in my results across time.
Below is a link to one of the lip syncs that I spliced.
https://vimeo.com/manage/videos/545766906
From those videos, I collected data on the
- Duration
- Individual Screen Times
- Shared Screen Times
- Confessionals about the winner (positive and negative)
- Confessionals about the loser (positive and negative)
- Personal confessionals from the Bottom Two queens
- If the guest judge that episode was the song’s artist
- Sound effects used immediately prior to the lip sync (only applicable to seasons 6 and 7)
That data was then combined with Wikipedia data that contained the song name, the artist, and the eliminated queen. I used that data to come up with a metric to see how many times that queen has been in the Bottom 2 before. I also used the Spotify API to add in data about some of the songs’ aspects (danceability, tempo, and speechiness).
Preliminary Data Analysis
I immediately learned that many of these variables were irrelevant to predicting the outcome of the lip sync. However, I was happy to see that my two main predictors — screen time and sound effects — were clearly linked to the lip sync outcome.
First, the disappointing results.
Song Characteristics
I thought that maybe faster songs might impact screen time due to the ability to make more cuts to the beat and the more intense dance moves and tricks going on on stage. However, there was no clear pattern in the data. As a result, I decided not to include it in my regression analysis down the line.

sThrough similar exploratory analysis, I learned that the guest judges’ presence, positive, and personal confessionals have no effect on the outcome of the lip sync.
Screen Time
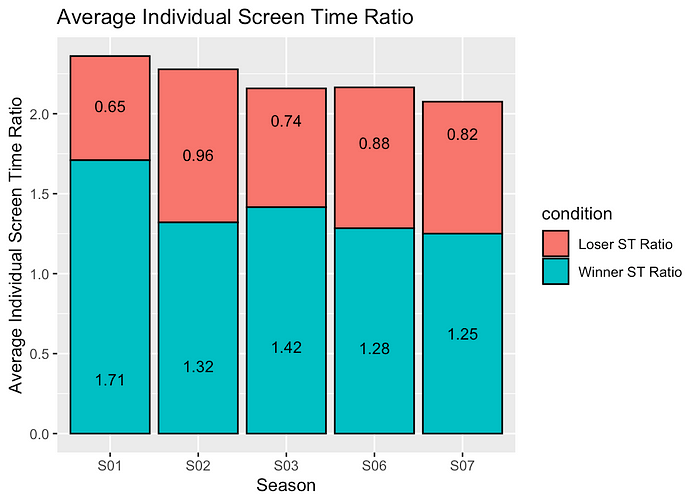
However, screen time stood out as a potential predictor for the winner of these lip syncs. Looking at the average screen time given to each of the queens each season, you can consistently see that the winner takes up the majority of the song. It is also interesting to note that as the seasons became more heavily edited, the percentage of winner screen time increased.

Then, I wanted to create a single screen-time metric to run the regression on. I came up with three potential options: a queen’s screen time to the entire duration of the lip sync, a queen’s screen time to the duration of the individual screen times plus the shared screen time, and a queen’s screen time compared to her opponent's. While they all were statistically significant in my model, I found the last one to make the most intuitive sense.

Sound Effects
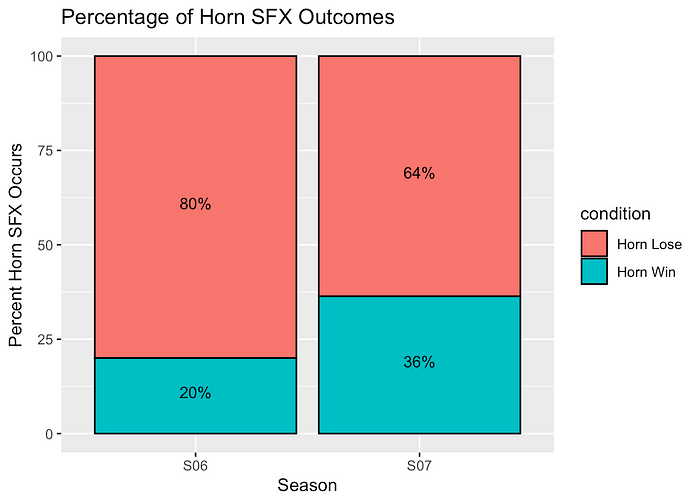
Season 6 and 7 are the only two I looked at that employed the new thunder and horn sound effects (season 6 was the first season to ever employ them). In season 6, the thunder-sound-effect queen overwhelmingly won, leading me to wonder if the editors saw those Reddit posts and began to switch the sounds up more.

Regression Analysis
The first version of my model just included the individual screen time ratio for all five seasons. This metric was extremely significant, with a p-value of 1.59e-09. That simple linear regression had an adjusted R-squared of 0.3269 and a p-value of1.587e-09.

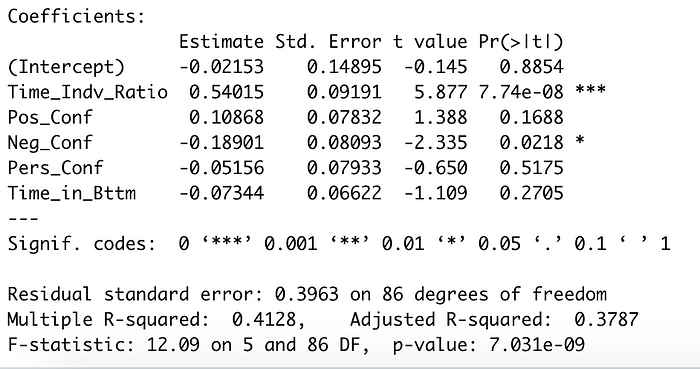
With all the variables included for my next model, I began to pare down the variables I wanted to use. Surprisingly, the metric that captured how many times a queen had been in the Bottom Two before was not statistically significant. For the five seasons, only the time ratio and the negative confessionals from other queens were significant predictors of the outcome.
The negative confessionals as a predictor also made sense, since positive confessionals were common since many of the queens made friends throughout the season who would be featured during their lip syncs. However, when someone gave a queen a negative review, it was almost always because they were bad (save for Roxxxy Andrews’s comment on Jinx season 5 during her lip sync against Detox).
Focusing on Season 6 and 7
I found a regression on two variables to be boring, especially since Drag Race has evolved so much over the years. I wanted to include sound effects in my predictive model.
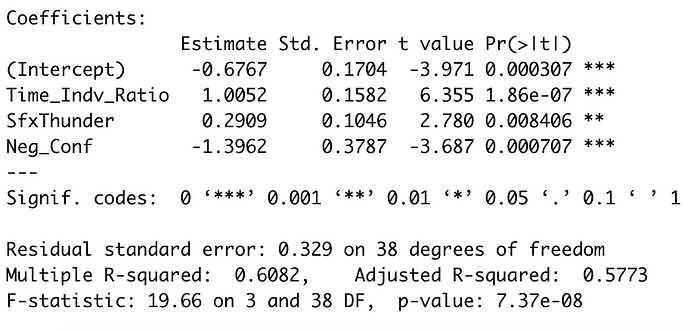
In my linear regression for these two seasons, I included the individual screen time ratio, negative confessionals, and the sound effect data — all of which were significant. There were a total number of 21 episodes used in this regression (data on 42 queens).

Finally, I wanted to see if I could use the season 6 data to predict the outcomes for the season 7 lip syncs. My train model was 85% accurate on itself, and, when I fed in the season 7 data, the model had a 90.9% accuracy using a threshold of 0.57.
In the future, I would like to collect data on the other episodes to do a true analysis of how the show has changed. I see this type of project as the gay version of sports analytics, and I would love to bring that data to the community. When I was searching online for this kind of dataset, I found other people looking for the same thing, so, while it may seem silly, at least we’re silly together. ❤ xoxo Natalia
